Energetics of Gait
The displacement of the CM during walking and running largely depends on how the involved muscles accommodate the ground reaction forces that act on each foot during the stance phase. As described in this section, the displacements produced by the applied forces, which differ during walking and running, modulate the energy state of the body.
Leg Spring Stiffness
Running and hopping have been characterized as actions that enable us to move along the ground like a bouncing ball. To accomplish this action, the legs behave as springs, and this enables us to model the human body as a spring - mass system. The leg spring is compressed during the first half of the stance phase, which corresponds to a lengthening of the muscles and tendons, and rebounds during the second half (figure 4.10). Just as a spring stores elastic (strain) energy when it is compressed, so too active muscles and tendons store elastic energy when they are lengthened. The mechanical characteristics of the spring are expressed as leg stiffness (example 4.2). The magnitude of leg stiffness influences the duration of the stance phase and the vertical displacement of the CM during the stance phase. This capability enables us to use a range of stride rates and stride lengths to run at a given speed. Furthermore, we tend to change leg stiffness when running on surfaces of different stiffness (e.g., concrete floor vs. rubber mats) so that the total vertical stiffness (leg stiffness + surface stiffness) remains constant. Regulation of the total vertical stiffness enables us to use similar running mechanics on different surfaces, such as constant stance phase duration, stride rate, and vertical displacement of the CM. Moreover, the application of an elastic ankle - foot orthosis that supplements ankle stiffness enables an individual to reduce the leg stiffness that must be provided by muscle activity.

A spring - mass model of the human body at three points during the stance phase of running. The large filled circle represents body mass; the spring indicates the leg. Compression of the leg spring is indicated by the vertical displacement (Δ
y) of body mass.
Adapted from
Journal of Biomechanics, D.P. Ferris, K. Liang, and C.T. Farley, "Runners adjust leg stiffness for their first step on a new running surface," pg. 790, Copyright 1999, with permission from Elsevier.
www.sciencedirect.com/science/journal/00219290
Leg stiffness in running depends on the level of muscle activity and the geometry of the leg when the foot contacts the ground. The effect of varying muscle activity is to alter the stiffness at a joint. We have previously discussed linear springs, such as tendons, ligaments, and therapeutic bands, but there are also angular springs; these are known as torsional springs. A common example of a torsional spring is a snapping mousetrap. Torsional springs resist angular displacement due to a property known as angular stiffness (κ). Muscles act as torsional springs when they perform lengthening contractions to resist the angular displacement caused by a load. This occurs during the first half of the stance phase of running when the leg extensor muscles (ankle, knee, and hip) perform lengthening contractions to oppose the downward acceleration of the CM caused by gravity.
The other factor that influences leg stiffness in walking and running is the orientation of the leg at footstrike. Changes in leg geometry alter the perpendicular distance (moment arm) from the line of action of the ground reaction force vector to each of the major joints (ankle, knee, and hip) and hence the load that the muscles must counteract. The changes in the direction of the net muscle torque about the hip, knee, and ankle joints during the stance phase of walking indicate when the line of action for the ground reaction force vector passes in front of and behind each joint. For example, the change in the direction of the net muscle torque about the ankle joint from a flexor to an extensor torque early in the stance phase (figure 4.11) indicates when the line of action moved from behind to in front of the ankle joint. Similarly, the changes between flexor and extensor net muscle torques at the knee and hip during the stance phase (figure 4.11) indicate when the line of action shifted from one side of the joint to the other side. Because the net muscle torques about the hip, knee, and ankle joints are mainly in the direction of extension during the stance phase of running, the line of action passes in front of the ankle joint, behind the knee joint, and in front of the hip joint for most of this time. Total leg stiffness, which depends on the sum of the torques at the three joints, is dominated by the larger torques about the ankle joint. The net muscle torques are greater during the stance phase of running than during the stance phase of walking due to differences in both ground reaction forces and the moment arms at each joint.

Average net muscle torque about the ankle, knee, and hip joints during the stance (0%-62% of stride time) and swing phases of level walking for eight young adults. Positive torque indicates a net extensor torque; conversely, negative torque represents a net flexor torque.
Data provided by Jason R. Franz, PhD.
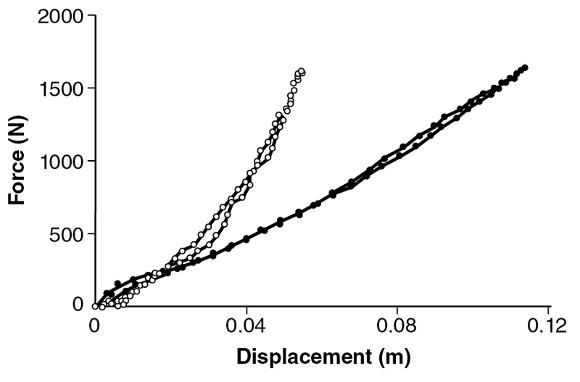
To examine the relative contributions of muscle activity and leg geometry to variation in leg stiffness, Claire Farley and colleagues (1998) studied humans hopping on surfaces of different stiffness. They characterized the behavior of the leg spring by plotting the vertical component of the ground reaction force (F g,y) against the change in leg length (Δl; figure 4.12). The bottom left corner of the graph (figure 4.12) represents when the foot contacted the ground, after which the length of the leg spring decreased and F g,y increased. Peak F g,y occurred when the leg spring was maximally compressed. The slope of this relation (Δl and F g,y) indicates the stiffness of the leg spring (N/m). The stiffness of the leg spring was least when subjects hopped on the stiffest surface; it went from 14.3 kN/m on the stiffest surface to 29.4 kN/m on the least stiff surface for the subject shown in figure 4.12.

The change in leg length and the vertical component of the ground reaction force for a subject hopping in place on a stiff surface (filled circles) and one that was less stiff (open circles).
Data from Farley et al. 1998.
To determine how subjects changed leg stiffness, Farley and colleagues (1998) calculated joint stiffness when the subjects hopped on the various surfaces. Joint stiffness (κ) was determined as the ratio of the change in resultant muscle torque to the angular displacement (N•m/rad):
(4.3)
They found that the stiffness of the ankle joint had the greatest effect on leg stiffness for this hopping task. Ankle stiffness changed from 396 N•m/rad on the stiffest surface to 687 N•m/rad on the least stiff surface, accounting for 75% of the change in leg stiffness. They also found that subjects flexed the knee by 0.16 rad when going from the least to the most stiff surface, which changed the moment arm for F g,y relative to the knee joint from 0.001 m to 0.054 m. This change in leg geometry caused the leg stiffness to change from 17.1 to 22.2 kN/m. Of these two factors, changes in ankle joint stiffness had the greater effect on the variation in leg stiffness, at least for hopping in place. The role of leg geometry may be more significant in running, where it appears that stiffness about the knee joint has the greatest effect on changes in leg stiffness.
Energy Fluctuations
When most of us walk or run, we pay little attention to either the length or the rate of the strides that we use to achieve a particular speed. If we experiment with different combinations of stride length and rate for a range of speeds, it becomes obvious that there is one combination that seems to require the least effort to achieve a desired speed. Biomechanists have examined this perception by calculating the energy costs needed to perform the work of walking and running at different speeds.
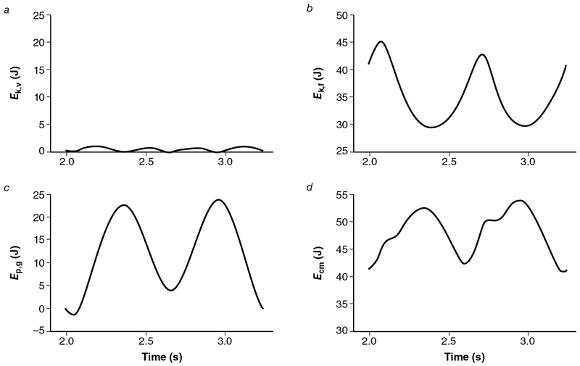
Most of the work done during walking and running is used to displace the CM in the vertical (U v) and forward (U f) directions. These two components are sometimes referred to as external work, to distinguish them from the work (internal) done to move the limbs. The mechanical energy used to perform external work is derived from the kinetic (Ek) and gravitational potential (E p,g) energy for the CM. In the vertical direction, the amount of work done (U v) depends on the change in both E k,v and E p,g. In the forward direction, however, the amount of work done (U f) depends only on the change in E k,f. Because the fluctuations in E k,v are so small compared with those of the other two energy terms, it is often neglected. Thus the total mechanical energy of the CM (E cm) is mainly due to the sum of E p,g and E k,f (figure 4.14).
Fluctuations in mechanical energy of the CM within one stride (two support phases) during walking. Note that the gravitational potential energy (
E p,g) reaches a minimum when the forward kinetic energy (
E k,f) is at a maximum, resulting in a sum for the CM (
E cm) that fluctuates less than the individual components. Fluctuations in
E cm indicate the external work done on the CM.
E k,v represents the kinetic energy in the vertical direction.
Adapted from Griffin, Tolani, and Kram 1999.
Because the vertical position of the CM reaches a maximum in midstance during walking but a minimum at the same point during running, there are differences between walking and running in the contributions of the energy fluctuations to the external work done on the CM. When the knee is kept extended and the leg used as a strut during walking, E p,greaches a maximum and E k,f achieves a minimum at midstance. The fluctuations in E p,g and E k,f are inversely related (figure 4.14) because some of the change in E p,g results from the forward motion of the body (E k,f) and some of the change in E k,f is produced by changes in the vertical position of the CM (E p,g).
The amount of energy that is exchanged between potential and kinetic can be quantified as the percentage of energy that is recovered (percentage recovery). To calculate percentage recovery we subtract the external work (U e) from the work done in the vertical and forward directions:
(4.5)
The amount of mechanical energy recovered during walking at intermediate speeds is approximately 65%, compared with <5% in running. The percentage recovery is greatest when U v and U f are similar, which occurs at intermediate walking speeds. At lower (U v > U f) and higher (U v < U f) speeds, the external work increases and the percentage recovery declines. Similarly, when reductions in gravity are simulated by means of partial support of body weight, the percentage recovery decreases as the amount of body weight support increases, and the speed at which maximal recovery occurs declines with an increase in support.
Energy Cost
When we run a short distance at several different speeds, it is evident that the rate at which we consume energy increases as we run faster. This is obvious by the increases in heart rate, ventilation rate, and the rate of oxygen consumption when we run faster. The increase in the rate of energy expenditure appears to be mainly due to the increase in the intensity of muscle activity that is needed to run faster. In general, the muscle activity during walking and running serves two major functions: to support body weight and to generate a propulsive impulse. Because the magnitude of the vertical component of the ground reaction force is much greater than the magnitude of the forward - backward component (see figure 2.11 for the graph of ground reaction forces), most of the metabolic energy we expend during running is used to support body weight.
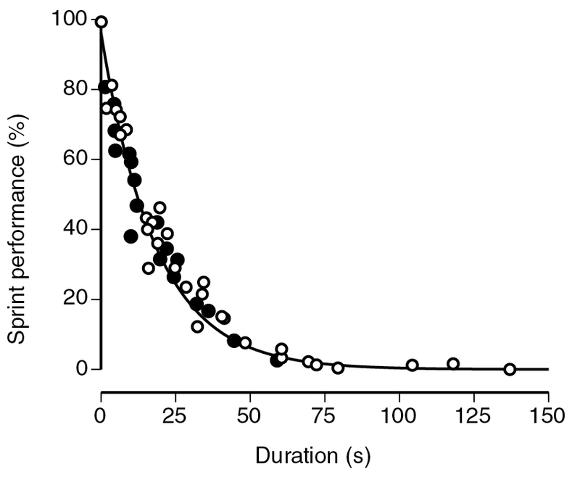
Three types of experiments have been performed to determine the contributions of body weight support to the metabolic energy cost of locomotion. These experiments have included measuring the metabolic cost of locomotion (rate of oxygen consumption) when extra mass is added, when gravity is reduced, and when different species locomote at various speeds. The general conclusion from these studies is that the magnitude of the vertical component of the ground reaction force (peak F g,y) is a major determinant of the metabolic cost during running at a constant speed. Moreover, the percentage of maximal sprint performance that can be sustained during running and cycling decreases with the duration of force application (figure 4.16) and for performances ≤60 s is limited by the decline in force capacity of the involved muscles and not the availability of metabolic energy (Bundle & Weyand, 2012).

Sprint performance (percentage maximum) declined as a function of the duration that force was applied during maximal running (filled circles) and cycling (open circles) trials. Sprint performance was quantified as speed during running and power production during cycling.
Reprinted, by permission, from M.W. Bundle and P.G. Weyand, 2012, "Sprint exercise performance: does metabolic power matter," Exercise and Sport Sciences Reviews 40: 174-182.
The energy cost of running varies with conditions in which the movement is performed, such as the presence of tail and head winds, the slope of the terrain, and the stiffness of the support surface. Chang and Kram (1999) examined the influence of tail and head winds by applying horizontal forces to treadmill runners that aided or impeded the task of running at a constant speed (3.3 m/s). The effect of this intervention was to modify the relative magnitudes of the braking and propulsive impulses in the forward - backward direction. The force that impeded running was similar to a head wind, which caused an increase in the propulsive impulse. Conversely, a force that aided the runner was similar to a tail wind and produced an increase in the braking impulse. By comparing the rate of oxygen consumption with changes in the propulsive impulse, Chang and Kram (1999) concluded that the muscle activity associated with generating the propulsive impulse accounts for ~30% of the metabolic energy we use when running at slow speeds.
The slope and stiffness of the terrain also influence the energy cost of running. Running on a slope requires changes in both the vertical and forward - backward components of the ground reaction force. The peak vertical component occurs earlier in the stance phase and the forward - backward component is dominated by the braking impulse when running downhill, whereas the converse changes are observed when running uphill. As a result of these adjustments, the most economical gradient is approximately -10% during running at 3 to 4 m/s, where the energy cost is ~3 J/kg•m-1. The increased metabolic cost of running uphill is related to the cost of elevating the CM; two-thirds of the increase in energy expenditure is due to the greater requirement by the muscles that are active during the stance phase, and the other one-third is used by the muscles that control the swing phase. Similarly, a decrease in surface stiffness from 950 to 75 kN/m is accompanied by a decrease in the metabolic cost of running at 3.7 m/s of ~10%, presumably due to an increase in the utilization of elastic energy by the muscles on the more compliant surface.
The greater energy cost of running compared with walking, therefore, is due to the greater muscle activity (figure 4.9) needed to support body weight when landing from an aerial phase and to generate an adequate propulsion impulse.


Комментариев нет:
Отправить комментарий